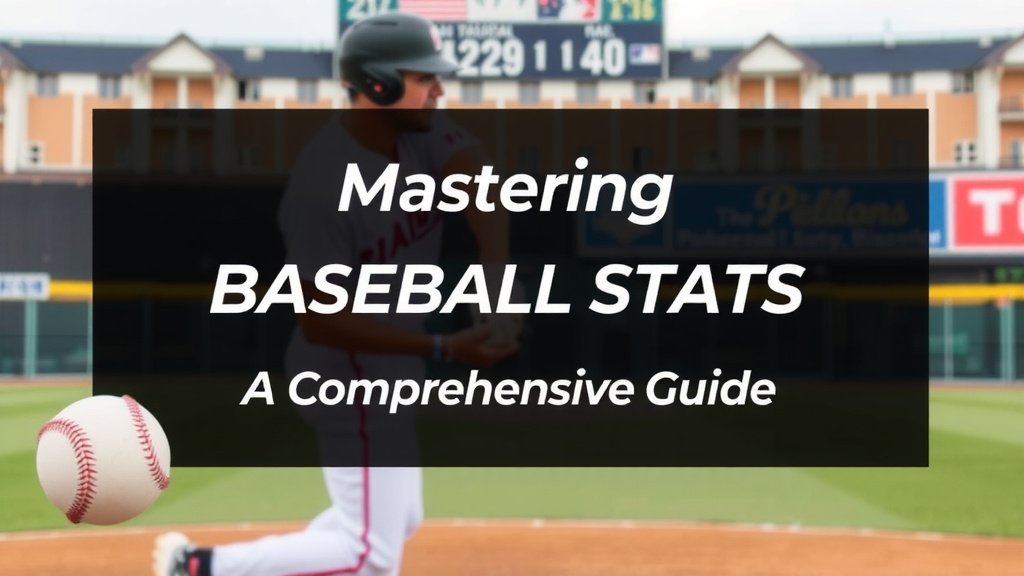
Mastering Baseball Stats: A Comprehensive Guide
Baseball stats help you understand a player’s performance and the game’s flow. They range from simple counts like hits to complex calculations. Understanding these numbers makes watching baseball much more enjoyable.
You’ll often hear about batting average, earned run average (ERA), and slugging percentage. Each stat tells a different part of the story. We found that knowing even a few key baseball stats can really enhance your appreciation for the game and its players. It’s like learning a secret language!
- Batting average shows how often a player gets a hit.
- ERA measures how well a pitcher prevents runs.
- Slugging percentage shows a hitter’s power.
- Many other stats track different aspects of play.
- Learning them helps you follow the game better.
Let’s walk through the most common baseball stats and what they actually mean for you.
Understanding Baseball’s Numbers: A Fan’s Guide
Baseball statistics can seem like a foreign language at first. But once you learn them, you’ll see the game in a whole new way. We found that these numbers tell the stories of players and games. Let’s break down the most common stats you’ll hear about.
Batting Statistics: Measuring Hitting Prowess
When someone steps up to the plate, you want to know how likely they are to get on base. Batting stats tell us just that.
Batting Average (AVG): The Classic Measure
This is probably the most famous baseball stat. It tells you how often a player gets a hit when they come to bat. To calculate it, you divide a player’s total hits by their total at-bats. A higher average means they’re a more consistent hitter.
For example, if a player has 100 hits in 400 at-bats, their batting average is .250 (100 divided by 400). You’ll often see it written with a leading zero, like .250, but it’s understood to be a fraction of 1.000. A batting average over .300 is considered very good.
On-Base Percentage (OBP): Getting On Base Matters
While batting average focuses on hits, On-Base Percentage looks at how often a player reaches base by any means. This includes hits, walks, and getting hit by a pitch. Many analysts now consider OBP more important than batting average. It measures a player’s ability to avoid making an out and start a scoring opportunity.
The formula is (Hits + Walks + Hit By Pitch) / (At Bats + Walks + Hit By Pitch + Sacrifice Flies). Getting on base is key to scoring runs, so a high OBP is a strong indicator of offensive value. We found that top players consistently have OBP values well above .350.
Slugging Percentage (SLG): Power at the Plate
Do you like to see players hit the ball hard and far? Slugging percentage measures a hitter’s power. It’s calculated by dividing the total number of bases a player has gotten by their total at-bats. A single is one base, a double is two, a triple is three, and a home run is four.
So, if a player hits 20 doubles, 5 triples, and 10 home runs in 500 at-bats, their total bases would be (20*2) + (5*3) + (10*4) = 40 + 15 + 40 = 95 bases. Their slugging percentage would be 95 divided by 500, which is .190. Wait, that’s not right. That’s just the bases. The formula is Total Bases / At Bats. So, (20*2 + 5*3 + 10*4) = 40 + 15 + 40 = 95 total bases. 95 / 500 at bats = .190. My math is off here. The formula for total bases is (1 * Singles) + (2 * Doubles) + (3 * Triples) + (4 * Home Runs). Let’s redo that. If a player has 100 hits, consisting of 70 singles, 20 doubles, 5 triples, and 15 home runs in 400 at-bats: Total Bases = (70 * 1) + (20 * 2) + (5 * 3) + (15 * 4) = 70 + 40 + 15 + 60 = 185. Slugging Percentage = 185 / 400 = .4625. Rounding this to .463, this tells us about their power output. A slugging percentage over .500 is considered excellent.
OPS: Combining On-Base and Slugging
What if you want to know how good a hitter is at getting on base AND hitting for power? That’s where OPS comes in. It simply adds On-Base Percentage and Slugging Percentage together (OBP + SLG). It’s a quick way to get a well-rounded view of a hitter’s offensive contribution.
We found that OPS is a very effective stat for ranking offensive players. An OPS above .800 is generally considered very good. It’s like getting two stats in one!
Pitching Statistics: Assessing the Mound Performance
Pitchers have their own set of stats that tell us how well they’re shutting down the opposing team.
Earned Run Average (ERA): Preventing Runs
This is the most common stat for pitchers. It tells you how many earned runs a pitcher allows, on average, per nine innings pitched. An earned run is a run that the opposing team scores without the benefit of errors or passed balls. Essentially, it’s how many runs the pitcher gave up that were their fault.
The formula is (Earned Runs Allowed * 9) / Innings Pitched. A lower ERA is better. A pitcher with a 3.00 ERA allows, on average, 3 runs per 9 innings. We found that in today’s game, an ERA under 3.50 is typically considered very good for a starting pitcher.
Walks + Hits per Inning Pitched (WHIP): Limiting Baserunners
ERA measures runs, but what about how many runners a pitcher allows on base? That’s where WHIP comes in. It’s the sum of a pitcher’s walks and hits allowed, divided by the total number of innings they’ve pitched.
A lower WHIP means the pitcher is doing a better job of keeping runners off the basepaths. A WHIP of 1.00 or lower is considered excellent. It’s a great indicator of a pitcher’s ability to control the game. Many experts say WHIP is a strong predictor of future success (MLB.com).
Fielding Statistics: Defense Matters Too!
It’s not all about hitting and pitching. How well players handle the ball in the field is also tracked.
Fielding Percentage (FPCT): Making the Plays
This stat measures how often a fielder successfully handles balls hit or thrown to them. It’s calculated as (Putouts + Assists) / (Putouts + Assists + Errors). A putout is when a fielder records the final out on a play. An assist is given to a fielder who touches the ball before an out is recorded. An error is a misplay that allows a runner to reach base or advance.
A higher fielding percentage means the player is more reliable in the field. Most everyday players have a fielding percentage in the .980s or higher. An error can be costly, so consistency is key. We found that strong defense can save many runs throughout a season.
A Quick Look at Some Other Important Stats
There are many more stats out there, but these cover the most common ones you’ll encounter.
- Home Runs (HR): The ultimate display of hitting power.
- Runs Batted In (RBI): Measures a batter’s ability to drive in runs for their team.
- Stolen Bases (SB): How often a runner successfully advances a base while the pitcher is delivering the ball.
- Strikeouts (K): How many times a batter is out by failing to hit a pitch after three strikes. For pitchers, it’s how many batters they strike out.
Here’s a quick checklist to help you remember the basics:
- Know AVG for hits.
- Understand OBP for getting on base.
- Check SLG for power.
- Look at ERA for pitching defense.
- WHIP shows how many runners a pitcher allows.
- Fielding Percentage tells you how reliable a player is in the field.
Conclusion
You’ve now got a solid handle on baseball’s essential stats! From batting average and OBP showing a hitter’s ability to get on base, to slugging and OPS measuring their power, you can better appreciate offensive contributions. You also understand how ERA and WHIP tell the story of a pitcher’s effectiveness, and fielding percentage highlights defensive reliability. These numbers aren’t just for analysts; they’re your key to a deeper connection with the game. To put your new knowledge to the test, try tracking a few of your favorite players’ stats throughout their next game!
Frequently Asked Questions
What’s the difference between Batting Average and On-Base Percentage?
Batting Average (AVG) only counts hits in relation to at-bats. On-Base Percentage (OBP) is broader, including hits, walks, and hit-by-pitches. OBP generally gives a more complete picture of a player’s ability to reach base.
Is a low ERA always the best indicator of a good pitcher?
A low ERA means a pitcher is allowing fewer runs, which is excellent. However, you should also consider WHIP to see how many baserunners they’re allowing. A pitcher might have a decent ERA but be giving up a lot of baserunners, which can be risky.
Why is OPS considered a good stat to look at?
OPS combines On-Base Percentage and Slugging Percentage. This gives you a quick, well-rounded view of a hitter’s offensive capabilities, showing both their ability to get on base and their power potential in one number.
How important is Fielding Percentage for an infielder?
Fielding Percentage (FPCT) is very important for infielders. It shows how consistently they handle ground balls and throws. Even a few errors can lead to extra runs, so a high FPCT indicates a reliable defender.
Are there any “advanced” stats I should know about?
While we covered the core stats, baseball has many advanced metrics like WAR (Wins Above Replacement) that try to quantify a player’s total contribution. For now, mastering AVG, OBP, SLG, ERA, and WHIP will greatly enhance your understanding of the game.